Learn how to populate PowerPoint tables with data using placeholders and automatic table population.
Populating table - manual method: placeholders in table cells (basic)
You can use placeholders in any table cell to populate tables with dynamic data.
- Create a table in your PowerPoint slide
- Insert placeholders in table cells:
{{column_name}}in the same was as inside a text-box;
ATTENTION: this way does not iterate through the whole table from JSON or Excel file (lookup the next method if that's what you are after).
Sample table where you specify data from an Excel file
Table structure in PowerPoint template:
Note: "Employees" in this example is the name of the Excel Sheet from which data is to be inserted into the template (if your sheet is called "Sheet1", then use this as name in the data reference).
| Name | Department | |
|---|---|---|
| {{xlsx.Employees!A1}} | {{xlsx.Employees!B1}} | {{xlsx.Employees!C1}} |
| {{xlsx.Employees!A2}} | {{xlsx.Employees!B2}} | {{xlsx.Employees!C2}} |
xlsx. - this prefix instructs our engine to use Excel-style addressing to reference the data from the Excel file.
Sample Excel data file (visualization):
| A | B | C | |
|---|---|---|---|
| 1 | John Doe | john.doe@example.com | Sales |
| 2 | Jane Smith | jane.Smith@example.com | Marketing |
ATTENTION: For the example data above and example table to work use "Merge data with slides" option in the "How to process the data" section of the Processing Configuration article.
Sample table where you specify data from JSON file
Table structure in PowerPoint template:
Note: Indexes in JSON tables / arrays are zero-based.
| Name | Department | |
|---|---|---|
| {{employees[0].name}} | {{employees[0].email}} | {{employees[0].department}} |
| {{employees[1].name}} | {{employees[1].email}} | {{employees[1].department}} |
Sample JSON data file:
{
"employees":[
   {
     "name": "John Doe",
	   "email": "john.doe@example.com",
	   "department": "Sales"
   },
   {
     "name": "Jane Smith",
	   "email": "jane.smith@example.com",
	   "department": "Marketing"
   }
]
}
Populating table - automatic method: automatic table population
For Excel tables or JSON collections, you can automatically populate entire tables:
- Create a table in your PowerPoint slide with just the header row
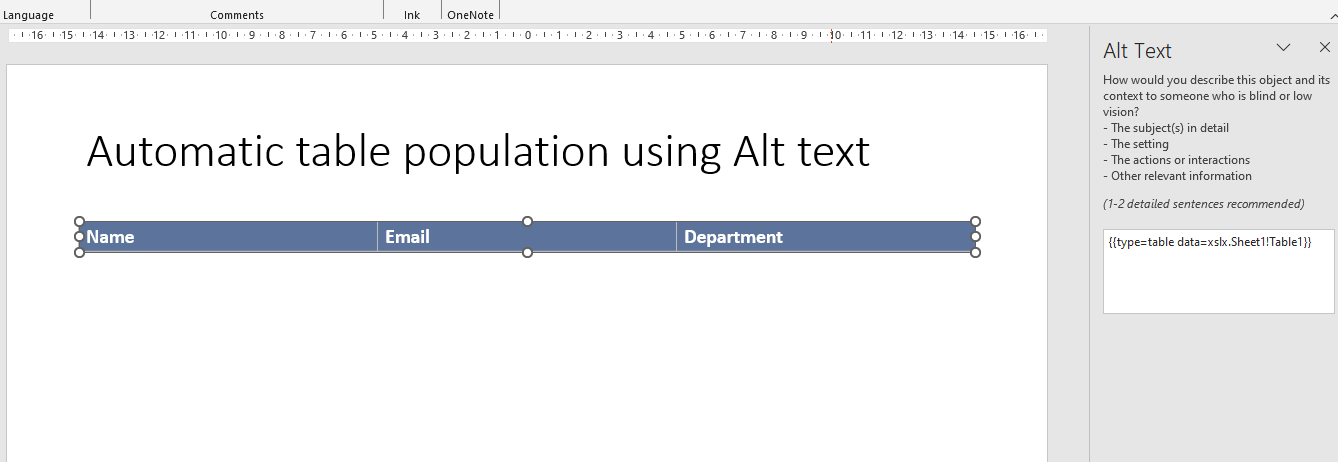
- Set the "Alt text" of the table to a placeholder expression that references your data source (to access "Alt text" editing click on the table and press Shift + F10 - then select "View Alt text"):
- for Excel: {{type=table data=xlsx.Sheet1!Table1}} - assumes you have a table called "Table1" in worksheet called "Sheet1" (you create tables in Excel by selecting data and pressing Ctrl+T / Command + T)
- for JSON: {{type=table data=json.employees}} - assumes "employees" is a collection at the topmost level in your JSON file
- The table will be automatically populated with all matching data
ATTENTION: The default logic of automatic table population is to try to fit the data from the table into the table created in PowerPoint. This means that if you have more data than the table can hold, the table will be populated with the data from the table and the remaining data will be ignored. Automatic table population does not overwrite the headers you give to your PowerPoint ta - the first row of the table is preserved. This gives you elasticity on how to present the data in PowerPoint. If you want further customizations of how the data is transferred between Excel and PowerPoint, you can use the columns and dataFilter parameters (described in the next sections).
Result:
- Slide 1: Table with John Doe's information
- Slide 2: Table with Jane Smith's information
Automatic table population - columns filtering and ordering
This is a simple example of how to select and order the columns of the table.
Assume that the Excel file includes a wider table (with many more columns) and you want to present just the three selected ones.
You can achieve this using the columns parameter.
The order of the columns is important - the first column in the list will be the first column in the table, the second column in the list will be the second column in the table, and so on.
Once again - if the placeholder table you have inserted into the PowerPoint has different number of columns than those in the columns parameter, the table will be populated with the data from the table and the remaining data will be ignored (or left empty).
Excel Example:
{{type=table data=xlsx.Sheet1!Table1 columns="months,chips,chocolate"}}
JSON Example:
{{type=table data=json.salesData columns="months,chips,chocolate"}}
Automatic table population - rows filtering
You do not need to include all the rows from the source data table - you can filter the data to show only the rows you need.
Excel Example (simple):
Assume you have an Excel table with the following data:
| ID | Name | Age |
|---|---|---|
| 1 | John Doe | 30 |
| 2 | Jane Smith | 25 |
| 3 | Jim Beam | 35 |
| ... | ... | ... |
| 100 | James Woods | 56 |
You can filter the table to show only the rows where the ID is greater than 30:
{{type=table data=xlsx.Sheet1!Table1 dataFilter="Age gt 30"}}
or
{{type=table data=xlsx.Sheet1!Table1 dataFilter="Age > 30"}}
Excel Example (advanced):
This example uses two features of our data processing instructions:
- data filtering (to filter the rows of the table)
- context variables (to reference the current row's data)
In the situation below you have:
- main (active) Excel sheet with influencer data
- and for each row of that sheet you want to attach additional data from the helper sheets (e.g. data regarding performance of each influencer - views, likes, etc.)
The type of table placeholder expression to use in your PowerPoint template is:
{{type=table data=xlsx.ReelsSheet!Table1 dataFilter="InfluencerID eq {{ID}}" columns="Content Type,Content URL,Engagements"}}
Advanced data filtering in tables is explored in the following article (you can download sample PowerPoint and Excel files to match): Influencer reporting with Excel and PowerPoint)
Data Filtering - expression reference
You can use the following expressions to filter the data (our engine supports logical and mathematical operators and grouping of expressions for complex filtering):
- gt / > - greater than
- lt / < - less than
- eq / == - equal
- ne / != - not equal
- le / <= - less than or equal
- ge / >= - greater than or equal
- and / && - and logical operator (e.g. Age > 5 and Age < 10)
- or / || - or logical operator (e.g. Age > 15 or Age < 10)
- () - parenthesis used for grouping of expressions (e.g. (Age > 5 and Age < 10) or (Age > 15 and Age < 20))
Formatting
Both simple and automatic table population preserve the formatting of the table from the template. The following will remain unchanged:
- Cell borders and colors
- Background colors
- Text formatting (bold, italic, colors)
- Column widths and row heights
- Alignment
Troubleshooting
Table Not Populating
- Check Placeholder Names: Ensure placeholder names match data field names exactly
- Check Cell Selection: Make sure placeholders are in the correct cells (for simple)
- Check Data Format: Verify your data contains the expected fields
- Check Table Name: For automatic population, ensure the table name (in Selection Pane) matches the placeholder expression
- Check Alt Text: For automatic population, ensure the Alt Text Description field contains the correct expression
- Excel Table Names: Verify Excel tables are properly formatted and named (use Name Manager: Ctrl+F3) - if not select the data and press Ctrl+T / Command + T to create a table and name it
Formatting Issues
- Lost Formatting: Ensure formatting is applied to the entire cell, not just part of it
- Column Width: Column widths from template are preserved
- Text Overflow: Long text may overflow cells - consider auto-fit options
Empty Cells
- Empty data values result in empty cells
- This is expected behavior
- Consider using default values in your data source